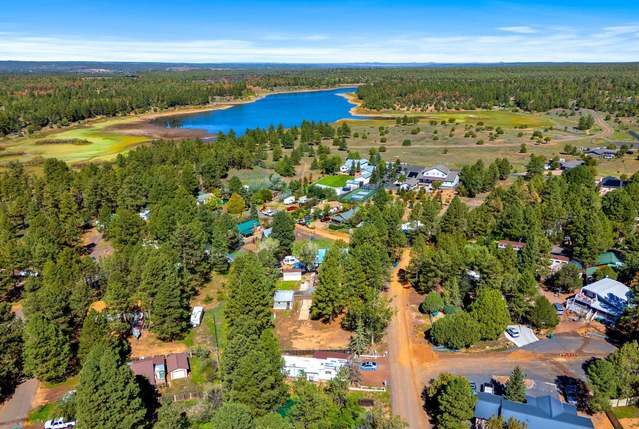
From Holbrook and Winslow to Show Low and Pinetop–Lakeside, commercial property owners in Navajo County face a unique blend of risks: large footprints, sparse after-hours traffic, highway-adjacent assets, seasonal tourism, and weather that can shift from monsoon downpours to winter ice. If you’re evaluating commercial property security Navajo County Arizona, your plan needs to combine proactive patrols, smart technology, rapid response, and a local operations rhythm that fits the county’s geography.
Why Navajo County is different
San Diego or Los Angeles models don’t simply “copy–paste” to Northern Arizona. Distances between assets are longer, staffing must be planned around drive times and weather, and threats vary by corridor (I-40 freight, rail-adjacent yards, highway motels, big-box retail, self-storage, lumber and light industrial). An effective program blends scheduled patrols for deterrence, targeted checks for hot spots, and remote monitoring that keeps eyes on your property when roads are slick or after-hours traffic is minimal.
A layered security framework for commercial sites
Patrol strategy that reflects your map (and your clock)
- Risk-based routes & frequencies: Increase pass-throughs at rear service alleys, loading docks, and low-visibility corners instead of patrolling evenly like a meter reader.
- Lock/Unlock routines: Time-stamped openings/closings for offices, retail, warehouses, and parks facilities.
- Parking and trespass control: Clear signage, trespass advisals, and LPR-supported parking enforcement for lots that turn into informal overnight stops.
Monitoring and alarms that trigger action
- Remote video guarding with talk-down: Analytics flag motion in restricted zones; live agents issue audio warnings and dispatch patrols.
- Sensor tiers: Door contacts, glass break, temperature/water alerts for equipment rooms—crucial during freeze events in the High Country.
- Verified alarm response: Patrol units arrive with site maps, key holdings, and post orders; body-worn camera footage and photos are attached to the incident report.
Documentation that stands up to audits and claims
- Digital incident reporting: Time-stamped notes, photos/video, and resolution status.
- Monthly trend brief: Repeat-call heatmaps, seasonal patterns, lighting/landscaping recommendations, and access-control tuning.
- Service-level scorecard: Arrival times, patrol coverage, and supervisor inspections with corrective actions when metrics slip.
Property-by-property playbooks
Retail & big-box centers near I-40
- Problems: Loitering, after-hours dumping, catalytic-converter theft.
- Controls: Staggered patrols, license plate recognition hits for banned vehicles, camera zones at dumpster corrals and rear service roads.
- Outcome metric: Fewer repeat calls within 60–90 days; shrink and nuisance activity trend down.
Light industrial, warehousing, and yards
- Problems: Perimeter breaches, copper theft, tool/fleet loss.
- Controls: Fence-line analytics, long-throw illuminators, sealed lock boxes for gate keys, and “first-on/last-off” escort patrols for third-party contractors.
- Outcome metric: Verified-alarm ratio (how many alerts produce evidence or intervention) and closeout times.
Hotels, highway motels, and hospitality
- Problems: Non-guest activity, parking-lot incidents, noise calls.
- Controls: Patrols that coordinate with front-desk, trespass documentation, nightly parking sweeps, and incident de-escalation training.
- Outcome metric: Reduced disturbance calls and improved online reviews tied to safety.
Self-storage and flex spaces
- Problems: After-hours access abuse, unit break-ins, tailgating at gates.
- Controls: Gate analytics, LPR for entry/exit, randomized patrol timing, and immediate door-checks on propped units.
- Outcome metric: Drop in forced-entry incidents and propped-door durations.
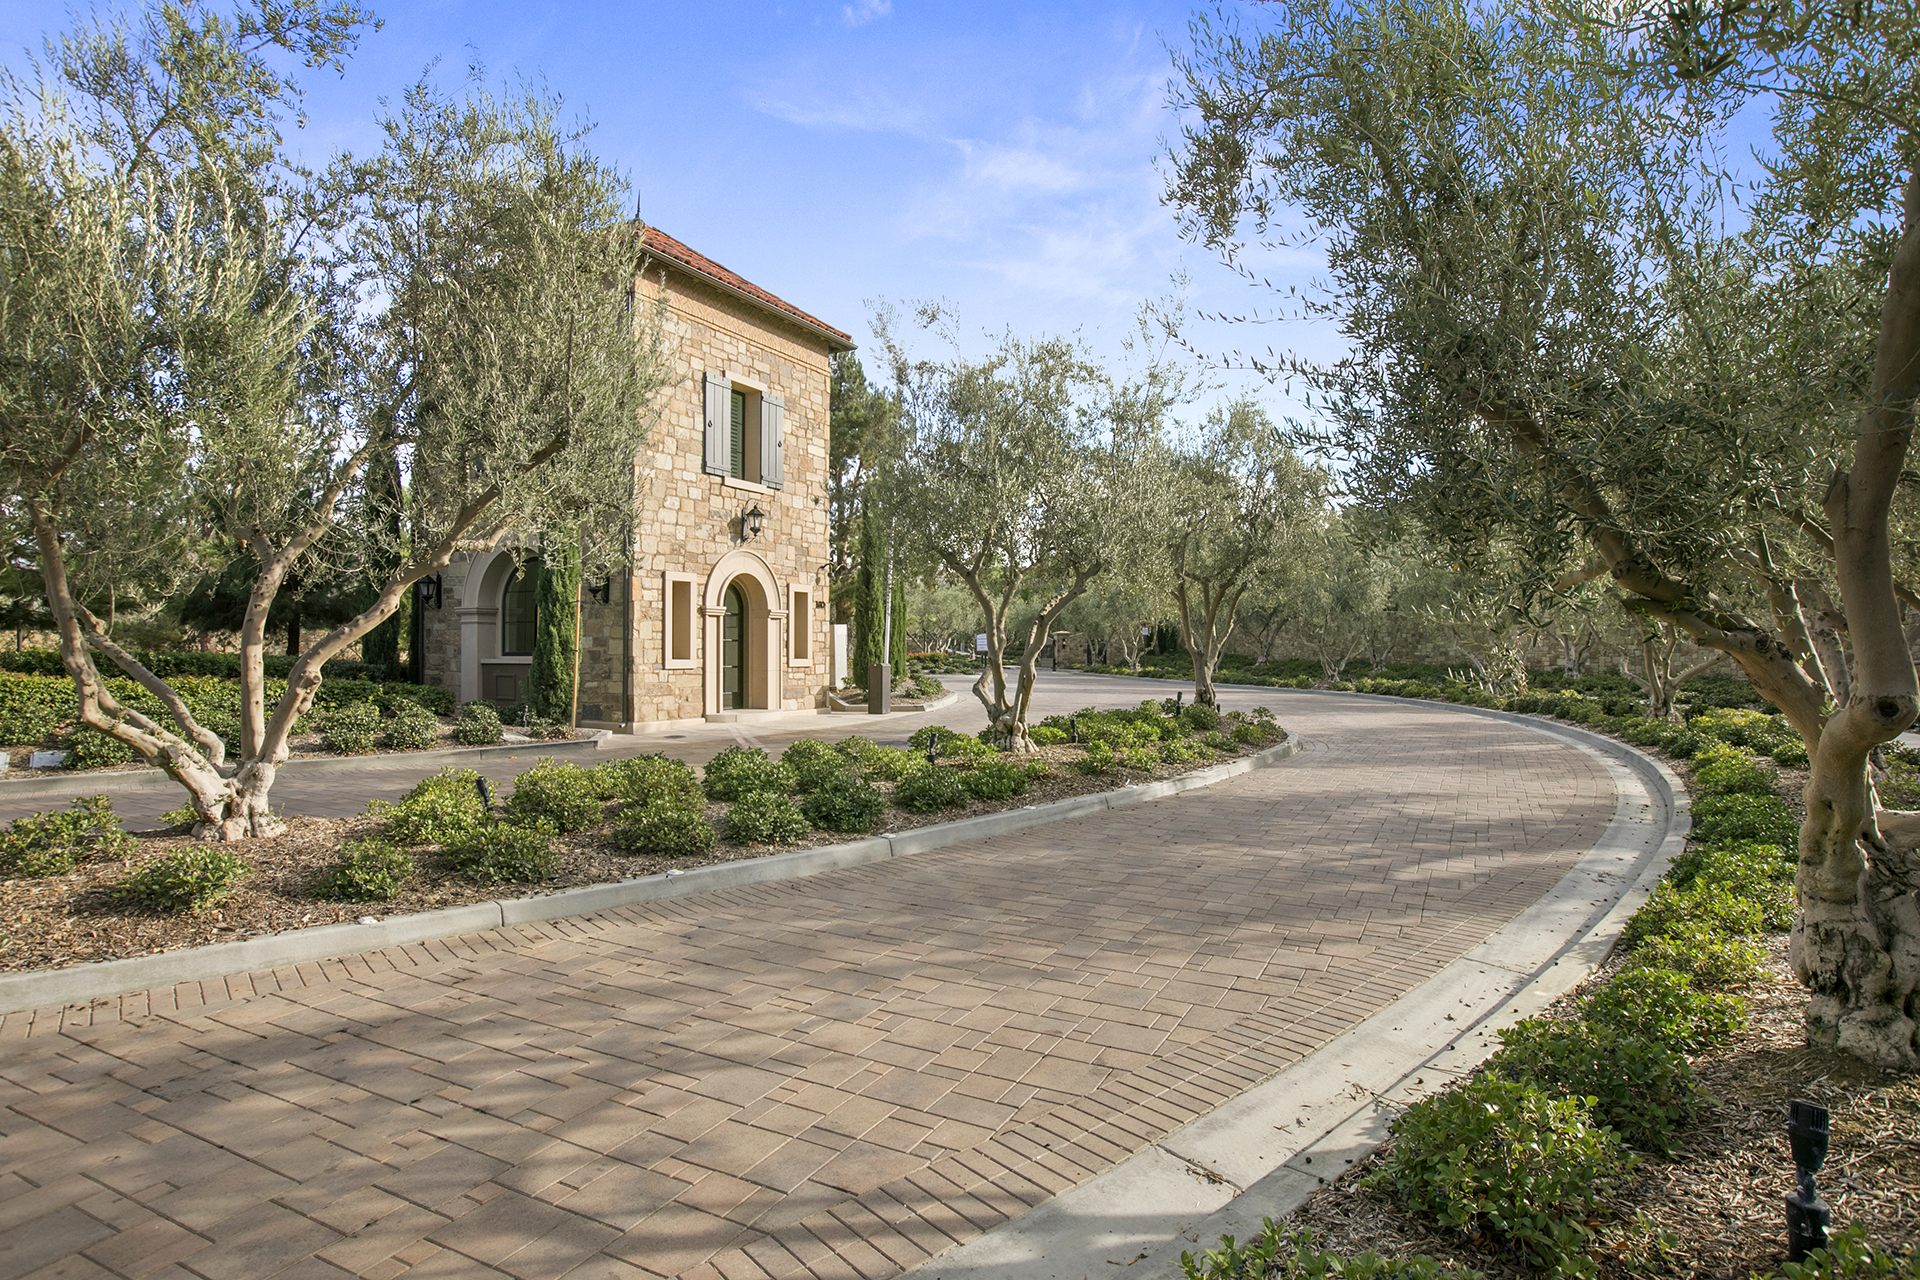
Business parks and professional offices
- Problems: After-hours trespass, smash-and-grab, vagrancy around dumpsters.
- Controls: Badge-only entry audits, glass-break sensors in lobby zones, and landscaping/lighting changes recommended from patrol observations.
- Outcome metric: Incident frequency per building and time-to-remediate environmental risks.
Building the plan: step-by-step
1) Site assessment and prioritized risks
Start with a walk-through at midday and after dark. Map blind spots, broken lighting, camera coverage, and common approach paths. Rank your top three risks per property and tie each to a control (e.g., “Rear dock theft → motion analytics + randomized patrols + improved lighting”).
2) Post Orders that read like instructions, not slogans
Post Orders should specify where, when, and how:
- Patrol cadence, checkpoint order, and photo documentation requirements
- Alarm response steps, from dispatch to police liaison
- Gate codes, key control, and vendor escort procedures
- Resident/tenant interaction standards and de-escalation expectations
3) Response orchestration and accountability
Insist on a 24/7 dispatch center, GPS-tracked units, and arrival/clear times in every report. Supervisors should audit patrols, ride along, and address gaps with retraining or schedule changes. The whole point: your risk, your schedule—not a generic route.
4) Technology that you actually use
Avoid stacks of apps. Choose one portal for reports, media, and live camera tiles. Confirm data ownership—you should retain access to reports and recordings even if you switch vendors.
Want to explore how mobile patrols support this framework? Read our related overview on [Commercial Security Services] (internal guide for service options and add-ons).
Compliance and due diligence
Arizona businesses benefit from benchmarks and statewide context. The FBI Crime Data Explorer provides property-crime definitions and state-level trend tools you can use to educate boards and owners.
What to measure each month
- Repeat-call reduction: Are the same doors, lots, or tenants showing up repeatedly?
- Time-to-arrival: Average and 90th percentile for alarm and tenant calls.
- Evidence rate: % of incidents with photos/video that support action or claims.
- Remediation follow-through: How fast are lighting, locks, and landscaping fixes completed?
- Customer sentiment: Manager/tenant feedback tied to safety and responsiveness.
Seasonality: plan for weather, tourism, and construction
- Winter: Slower traffic and longer response windows—front-load remote monitoring and confirm snow/ice access to gates and camera poles.
- Spring–Summer: Tourism and construction season—expect more after-hours activity around hotels, parks, and building sites; add patrol passes and gate monitoring.
- Monsoon: Power blips and water alerts—test UPS on NVRs, define who resets devices, and verify sump and roof sensors feed the SOC.
Why choose a regional partner that understands both AZ and CA
If your portfolio spans Arizona and Southern California, you’ll get better results with a provider that already runs cross-county dispatch and mobile patrol at scale. Shared playbooks, unified reporting, and consistent training mean fewer surprises—especially when your properties sit along the same logistics corridors as your California sites.
Call to action
Let’s build a Navajo County–specific plan you can hand to ownership tomorrow—complete with patrol maps, alarm response, and a month-one scorecard.
Call us at (888) 205-4242 or email [email protected] to request a site audit and a customized patrol plan.